Earnio results for April 2025
1 year ago
Tomáš Hucík
In my previous article, I mentioned how the market is slowly beginning to consolidate and how our strategies are more growth-oriented. Here, I would like to quote an article about Earnio's results from last month. It nicely sums up our approach:
"... However, the portfolio is still slightly more oriented towards long positions. It seems that the market is calming down a bit, at least at the time of writing this article (April 11), and the decline has stopped. When investing, it is most important to look at the broader, longer-term time frame. Investing and comparing results from month to month could distort the picture. If you do so, you may capitulate as soon as you incur the first few losses."
The first part of the quote shows that we correctly predicted the direction of the market. Although there was a significant decline in the first half of April, we maintained our long-term strategy.
Trading results in April
In April, we closed trading with a small loss of 0.5%. This result is satisfactory given the market decline in the first half of April. Although it may seem counterintuitive, it is true.
All losing trades resulting from this decline have already been closed. In the second half of April, only profitable trades were opened. Thanks to those that were closed during April, the loss for this month is only -0.5%.
What is even more positive is the outlook for May. Some of these profitable trades opened in April were closed by algorithms in May, so we have now a nice profit booked already for the moth of May.
We are still holding some positions open, and they continue to develop in our favor. Thanks to the use of trailing stops, positions are automatically closed when they reach a predetermined profit threshold. A trailing stop is a mechanism that allows you to track the price of an asset and automatically close a trade when the price begins to fall by a certain percentage from its peak.
This approach shows us how important it is to look at the market in the long term. Although there may be periods with several negative months, the results from a longer-term perspective are what really matter. April and May show us how important it is to stick to your plan.
Examples of profitable trades
Here are a few examples of trades that brought us profits in the second half of April. We will show both the database entry and what it looked like on the chart.
Trade 1:
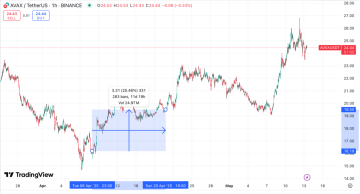
08. 4. 2025 23:59 – CGR: AVAXUSDT | Trading: BUY MKT filled | quantity: 3293.1 | avg fill price: 16.XX | fee: 17.1
20.4. 2025 18:59 – CGR: AVAXUSDT | Trading: SELL MKT filled | quantity: 3293.1 | avg fill price: 19.XX | fee: 37.6 | profit: 10 874.0

The image shows a CGR strategy trade on the AVAXUSD pair. CGR uses a mathematical oscillator model that calculates the deviation of the price from its center and is suitable for identifying areas where price reversals are likely to occur with minimal delay.
Trade 2:
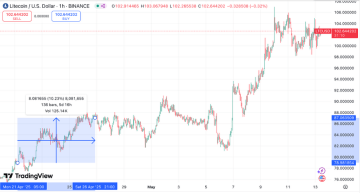
21. 4. 2025 05:59 – RFR: LTCUSDT | Trading: BUY MKT filled | quantity: 493.4 | avg fill price: 78.XX | fee: 12.5
26.4.2025 21:59 – RFR: LTCUSDT | Trading: SELL MKT filled | quantity: -493.4 | avg fill price: 87.XX | fee: 26.2 | profit: 3962.3

The image shows an RFR trade on the LTCUSD pair. RFR uses an advanced mathematical model to determine the probability of the next price. (All algorithmic strategies do this, but RFR uses a truly advanced mathematical and statistical model. Unfortunately, I can't reveal any more.)
This is just a small sample of the approximately 300 other trades we executed during the month.
Work on a new dashboard
In addition to developing strategies, my colleagues are now focusing on developing a new dashboard that will display real data in graphical form in real time.
This means that you won't need to search through databases or use complex analytical tools to get the information you need. This dashboard will allow even non-members of the trading team to easily monitor trading results in real time.
This will be particularly useful for colleagues in sales, who will have a real-time overview of the status of Dynamic strategies.
This will enable us to provide clients with granular and statistical data in a simple manner (number of trades, average position length, position sizes, etc.).
Market outlook
April 2025 opened with significant macroeconomic turbulence that reverberated through crypto markets. In early April, the U.S. reignited trade war fears by announcing steep new import tariffs – a move that initially spooked global investors and contributed to a Bitcoin price drawdown. This “tariff-driven” sell-off saw risk assets, including crypto, pull back as traders braced for potential economic fallout.
However, sentiment dramatically shifted later in the month when signs of a U.S.–China tariff truce emerged. On April 22, U.S. Treasury Secretary Scott Bessent called the existing 145% tariff structure with China “unsustainable,” hinting that relief was imminent.
President Donald Trump reinforced this optimism by vowing tariffs “will come down substantially,” and even assured markets that Federal Reserve Chair Jerome Powell would remain in his post (calming fears of Fed leadership upheaval).
These developments helped flip the macro narrative – by late April, China confirmed a suspension of its retaliatory tariffs, easing trade tensions and sparking a strong risk-on wave in global markets. Safe-haven gold fell on the news as investors rotated into equities and crypto, evidenced by Bitcoin’s swift recovery from its early-month lows.
BTC ETF flows
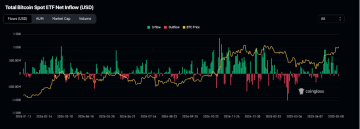
Institutional interest in Bitcoin surged in April, as evidenced by strong Bitcoin ETF flows throughout the month. After some choppiness in early April, capital began pouring into Bitcoin exchange-traded products at an unprecedented pace. The lion’s share went to BlackRock’s iShares Bitcoin Trust (ticker IBIT), which has emerged as the dominant U.S. spot Bitcoin ETF since its launch in January 2024. In late April, IBIT saw one of its largest single-day inflows ever – roughly $970.9 million in new investments on April 28.
This huge allocation (the fund’s second-largest daily inflow since inception) came as Bitcoin’s price was rebounding, and notably coincided with outflows at several competing ETFs. On that same day, ARK Invest’s Bitcoin ETF (ARKB) suffered an outflow of about $226 million, Fidelity’s FBTC lost ~$87 million, and Bitwise’s BITB saw ~$21 million leave. The pattern suggests that investors weren’t pulling out of Bitcoin altogether but were rotating their holdings into BlackRock’s fund, likely viewing it as a more liquid or trusted vehicle

Capital inflow into bitcoin ETF is growing again. Source: coinglass.com
This wave of institutional demand has been buoyed by improving market sentiment and Bitcoin’s price strength. It’s a stark contrast to the situation a year ago, when U.S. spot Bitcoin ETFs were first launching and skeptics wondered if there would be “no demand.” Now, the “paper Bitcoin” supply held by ETFs is growing rapidly, reflecting broader acceptance of Bitcoin as an investment asset. Major players like BlackRock (and to a lesser extent Fidelity, ARK, and others) are capturing most of these flows, which suggests that larger institutions and professional investors are driving the activity.
On-chain data
On-chain data from April tells a story of accumulation: large holders were moving Bitcoin off exchanges and into long-term storage at a remarkable rate. In fact, late April recorded one of the biggest exchange outflow events ever. On April 26, over 48,700 BTC left centralized exchanges in a single day, marking the third-largest daily Bitcoin outflow in history.
Such a massive withdrawal suggests that whales (large investors) were taking custody of coins – a bullish sign, as coins leaving exchanges are less likely to be sold imminently. Consistent with this, analytics firm Glassnode noted that wallets holding over 10,000 BTC significantly increased their balances in April, scoring a high Accumulation Trend Score of 0.90 (where 1.0 indicates aggressive net buying).Even mid-sized holders (1,000–10,000 BTC) showed strong accumulation with a trend score around 0.7.
In short, big players “bought the dip” during April’s early weakness and continued to HODL as the price recovered.
Market sentiment
In tandem with price and on-chain shifts, market sentiment among the crypto community swung sharply over April. The mood went from wary in early April to outright optimistic by mid-month, before tempering slightly into the month’s close. One popular barometer, the Crypto Fear & Greed Index, encapsulated this evolution.
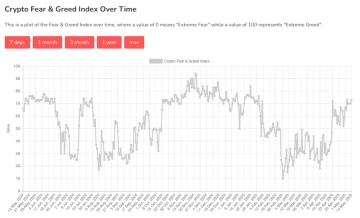
The index had been languishing in “Fear” territory at the start of April – around the mid-40s on its 0–100 scale, reflecting the pessimism as Bitcoin fell under selling pressure. But as the rebound took hold, sentiment rebounded as well. By April 23, with BTC pushing past $90K, the Fear & Greed Index leapt to 72 (“Greed”), its highest in over two months. This indicates that investors grew increasingly confident and even a bit FOMO-driven as prices surged.

The Fear and Greed Index shows a clear change in sentiment in recent days, but the question is how long this newfound optimism will last. Source: alternate.me
May outlook
Looking ahead into May 2025, the key question is whether the crypto market can maintain its positive trajectory. The early signals have been encouraging: in the first days of May, Bitcoin finally broke into six-figure territory, trading above $100,000 for the first time since February.
As of the second week of May, BTC is hovering around the $100K milestone, and other coins are testing their own highs. The rally’s continuation will depend on a mix of factors.
Macro catalysts remain in play – for instance, the 90-day U.S.–China tariff reprieve agreed upon in April is set to kick in by mid-May, which could further boost global risk sentiment if all goes smoothly. Likewise, markets are watching central banks: the U.S. Federal Reserve’s early May meeting and economic data (like the CPI inflation report) will influence appetites for risk assets.
So far, no adverse surprises have emerged on those fronts, which suggests a stable backdrop. Sentiment-wise, the Crypto Fear & Greed Index to start May is in the 60–70 range (Greed, but not extreme) – a notch below late April’s peak exuberance. This indicates traders are optimistic yet still somewhat guarded, which could actually be positive for sustainability.
